Master Debugging Raspberry Pi Hardware Projects
Category: Embedded Systems
Master Debugging Raspberry Pi Hardware Projects: A Practical Guide for Enthusiasts
If you’re a tech enthusiast, hobbyist, or developer diving into Raspberry Pi hardware projects, you know that even the most carefully planned builds can hit snags. Debugging Raspberry Pi hardware isn’t just about fixing errors; it’s about understanding your setup deeply—your circuits, connections, and code. Maybe your project won’t boot, your sensors aren’t responding, or unexpected resets occur without clear reasons. You’ve looked around for answers and found complex guides or partial fixes. This post is designed for your experience level—familiar with programming in Python, C/C++, or embedded development, and ready to tackle hardware issues systematically.
You likely searched for reliable, hands-on strategies to troubleshoot your Raspberry Pi projects effectively, to avoid hours of frustration and guesswork. Unlike generic software debugging tips, this guide focuses on integrated hardware-software diagnostics tailored to Raspberry Pi microcontroller interfacing. We'll walk you through best practices, tools, step-by-step diagnostics, common hardware faults, and debugging embedded systems, making your next project smoother and more satisfying. By the end, you’ll confidently isolate and resolve hardware issues, improving both your builds and your skills. Ready to transform your debugging headaches into clear, actionable insights? Let’s get started.
- Master Debugging Raspberry Pi Hardware Projects: A Practical Guide for Enthusiasts
- Understanding Raspberry Pi Hardware: Essential Components and Common Interfaces
- Essential Tools for Hardware Debugging
- Systematic Hardware Inspection: Step-by-Step Guide to Identifying Faults
- Troubleshooting Boot and Power Issues: Diagnosing No Boot, Frequent Resets, or Power Instability
- Debugging Sensor and Peripheral Failures: Verifying Sensor Output and Communication Buses
- Serial and Debug Console Usage: Leveraging UART and Serial Outputs for Low-Level Hardware Insight
- Software-Hardware Integration Debugging: Identifying Drivers, Code Bugs, and Hardware Malfunctions
- Firmware and Embedded Systems Debugging: Approaches for Raspberry Pi Compatible Microcontrollers
- Advanced Diagnostics with Logic Analyzers: Deep Debugging of Digital Signals and Communication Protocols
- Preventive Tips and Best Practices: Structuring Your Raspberry Pi Hardware Projects for Minimal Debugging and Maximum Reliability
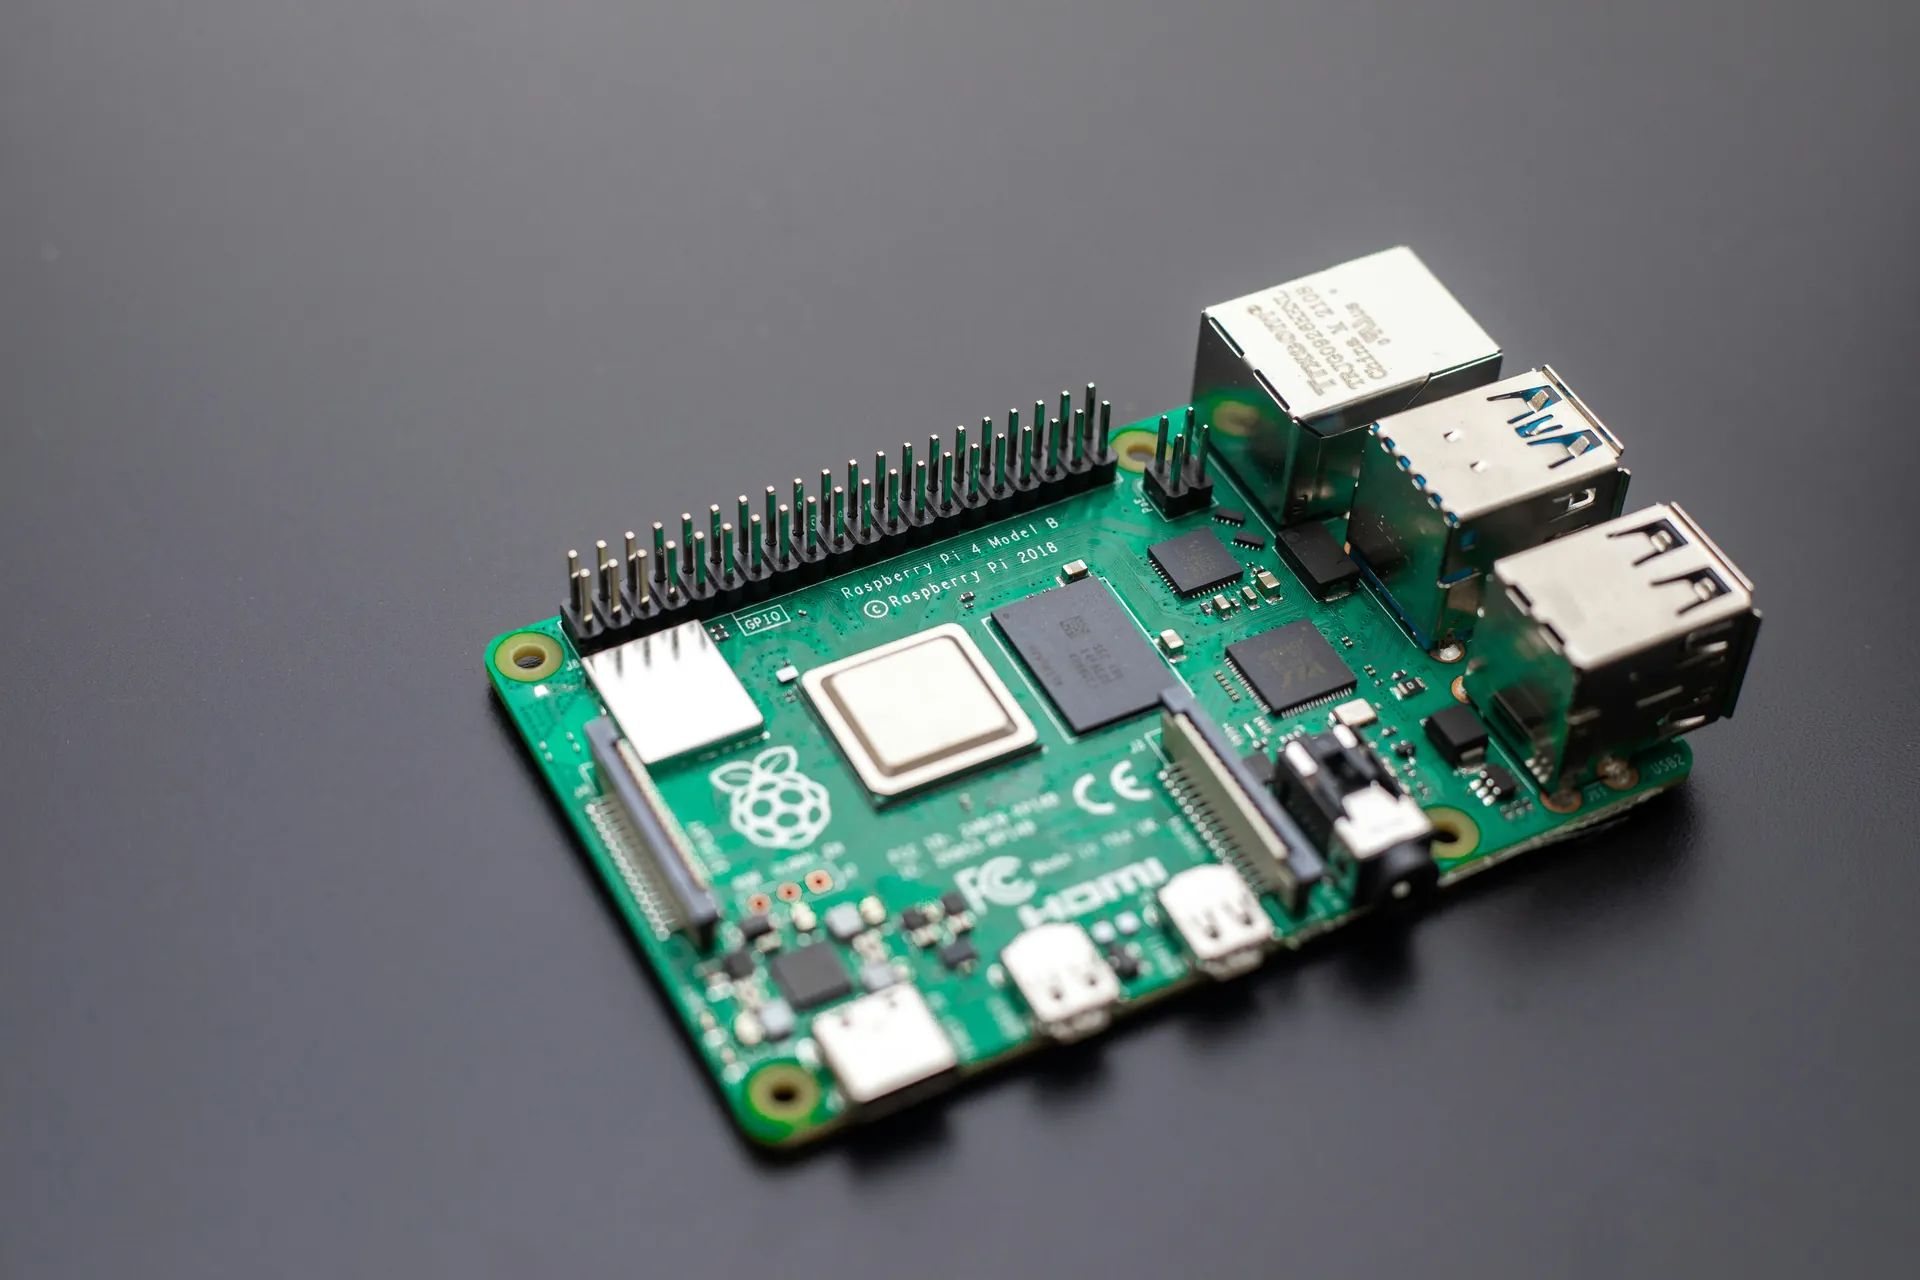
Understanding Raspberry Pi Hardware: Essential Components and Common Interfaces
To debug Raspberry Pi hardware projects effectively, it’s crucial to first grasp the core components and interfaces involved. The Raspberry Pi, a powerful single-board computer, integrates several key elements such as the CPU, GPIO pins, power management circuits, and communication ports. These elements form the backbone of your project’s interaction with sensors, actuators, and other peripherals.
Key Hardware Components to Know
-
GPIO (General Purpose Input/Output) Pins
These pins allow your Raspberry Pi to interface directly with various sensors and modules, supporting both digital and PWM signals. Misconfigurations or faulty wiring here often lead to the most common project issues, like sensors failing to respond or unexpected resets. -
Power Supply and Voltage Regulators
A stable and sufficient power source is foundational. Underpowered Raspberry Pis or unstable power can cause erratic behavior or boot failures. Understanding the voltage and current requirements for both the Pi and connected peripherals helps in isolating power-related faults. -
Communication Interfaces
- I2C: Used widely for interfacing with sensors like temperature, humidity, or accelerometers. Address conflicts or loose connections on I2C buses can cause read/write errors.
- SPI: High-speed interface for devices such as displays and ADCs. Incorrect mode settings or wiring mistakes commonly disrupt communication.
-
UART: Serial communication interface essential for debugging consoles or connecting GPS modules. Baud rate mismatches or cable issues can result in garbled data.
-
USB and HDMI Ports
While less involved in sensor communication, these ports interact with peripherals like keyboards, cameras, and displays. Faulty connections or hardware malfunctions here can also impact project functionality, especially for user interface components.
Why Understanding Hardware Context Matters for Debugging
Grasping these components and interfaces enables you to visualize the entire data flow and power distribution in your project. When a sensor fails to respond or the Pi doesn’t boot correctly, knowing whether the issue lies with the GPIO pin configuration, I2C bus collision, or inadequate power supply focuses your troubleshooting efforts immediately, reducing guesswork.
In addition, familiarity with Raspberry Pi’s hardware architecture helps in leveraging diagnostic tools like multimeters, logic analyzers, and oscilloscopes more effectively. It also aligns your software debugging—whether in Python or C/C++—with actual hardware behavior, ensuring you test, isolate, and fix the true root causes.
By developing a solid understanding of these fundamental Raspberry Pi hardware components and their typical failure points, you’re already half way towards mastering the debugging process and producing reliable, robust embedded projects.

Image courtesy of Mathias Wouters
Essential Tools for Hardware Debugging
Effective debugging of Raspberry Pi hardware projects hinges on having the right tools at your disposal. These tools bridge the gap between your Raspberry Pi’s software instructions and the physical electronic signals running through your circuits, enabling you to pinpoint faults efficiently. Whether you're testing voltage levels, signal timing, or communication protocols, incorporating essential hardware and software diagnostic instruments is key to faster problem resolution and deeper system insight.
1. Multimeters: The Fundamental Diagnostic Tool
A digital multimeter (DMM) is the most indispensable tool for any hardware debugging task. It allows you to measure:
- Voltage across GPIO pins or power rails, confirming whether components receive adequate power.
- Current flow, which helps detect short circuits or excessive power draw in peripherals.
- Resistance and continuity, to verify wiring integrity and detect broken traces or solder joints.
Multimeters are beginner-friendly yet vital for quickly ruling out power and connection issues that often mask as complex faults.
2. Oscilloscopes: Visualizing Signal Behavior
An oscilloscope takes debugging a step further by graphically displaying voltage waveforms over time. This is especially useful for:
- Analyzing digital signals on GPIO pins for correct timing and logic levels.
- Observing pulse-width modulation (PWM) signals that control motors or LEDs.
- Debugging communication lines such as I2C, SPI, and UART by capturing real-time data traffic and spotting glitches or noise.
For Raspberry Pi projects involving sensors or real-time control, oscilloscopes provide crucial temporal insights hardware troubleshooting tools alone can’t deliver.
3. Logic Analyzers: Decoding Digital Communications
When dealing with complex data buses and protocols, a logic analyzer becomes invaluable. It records multiple digital signals simultaneously, helping you:
- Monitor and decode I2C, SPI, and UART communication frames to identify errors such as framing issues or incorrect data packets.
- Capture and analyze timing relationships across many GPIO pins.
- Troubleshoot intermittent hardware faults by correlating signal patterns to software actions.
Combining a logic analyzer with protocol decoding software accelerates protocol-level debugging and integration testing.
4. Software Tools for Raspberry Pi Hardware Debugging
Hardware debugging isn’t limited to physical instruments. Several software utilities complement hardware testing by offering real-time monitoring and advanced diagnostics, including:
- GPIO debugging libraries (e.g., RPi.GPIO or pigpio) to control and test pin states programmatically.
- Serial terminal programs like minicom or PuTTY for UART console logging and communication testing.
- Protocol analyzers and simulators that work alongside logic analyzers or oscilloscopes, enriching analysis with visual decoding and error highlighting.
- System monitoring tools (e.g., vcgencmd, htop) for power, temperature, and resource usage insights linked to hardware performance.
Mastering these tools enables you to create a comprehensive debug workflow that blends electrical measurements with embedded software evaluation, critical to troubleshooting and perfecting Raspberry Pi hardware projects.

Image courtesy of IT services EU
Systematic Hardware Inspection: Step-by-Step Guide to Identifying Faults
A methodical hardware inspection is essential for efficiently diagnosing Raspberry Pi project issues, especially power irregularities, connection faults, GPIO pin errors, or peripheral malfunctions. Following a structured approach reduces guesswork and accelerates pinpointing the root cause, ensuring your debugging process is both thorough and effective.
1. Verify the Power Supply and Voltage Stability
Start by checking the power source:
- Use a multimeter to measure the voltage output of your power supply. Confirm it meets the Raspberry Pi’s required 5V with minimal fluctuation.
- Inspect the USB power cable and connectors for damage or loose fitting, as poor contacts can cause intermittent resets or boot failures.
- Measure voltage at the Pi’s 5V and 3.3V power rails on the GPIO header to ensure proper distribution. Voltage drops here often indicate wiring issues or overloaded peripherals.
2. Inspect All Physical Connections and Wiring
Next, carefully examine all wiring and connectors:
- Ensure GPIO pins are correctly wired according to your project schematic without loose or bent pins. Cross-check pin assignments with your code’s configuration to prevent conflicts.
- Test for continuity using a multimeter to detect broken wires or bad solder joints that interrupt signal paths.
- Verify connector seating on both the Raspberry Pi board and peripheral devices like sensors, displays, or HATs to eliminate poor contact faults.
3. Test GPIO Pin Functionality Individually
Isolating GPIO pins helps identify defective or misconfigured pins:
- Programmatically set and read GPIO pin states using libraries such as RPi.GPIO or pigpio to confirm responsiveness.
- For input pins, test with known signals or triggers; for output pins, connect LEDs or multimeter probes to check signal generation.
- Beware of damaged pins that may cause shorts or erratic behavior, often resolved by bypassing or substituting them.
4. Validate Peripheral Devices and Interfaces
Finally, evaluate connected peripherals and communication buses:
- For I2C and SPI devices, use software utilities like
i2cdetector SPI test scripts to confirm device addresses and communication integrity. - Check for bus conflicts or address collisions that may prevent sensors from responding.
- For UART interfaces, test data transmission with serial terminal programs and ensure baud rates match on both ends.
- Power peripherals separately if necessary to prevent overloading the Pi’s 3.3V rail.
By consistently applying this step-by-step inspection method—starting from power, through connections, GPIO pins, and peripherals—you create a reliable debugging workflow that minimizes downtime and maximizes the stability of your Raspberry Pi hardware projects.
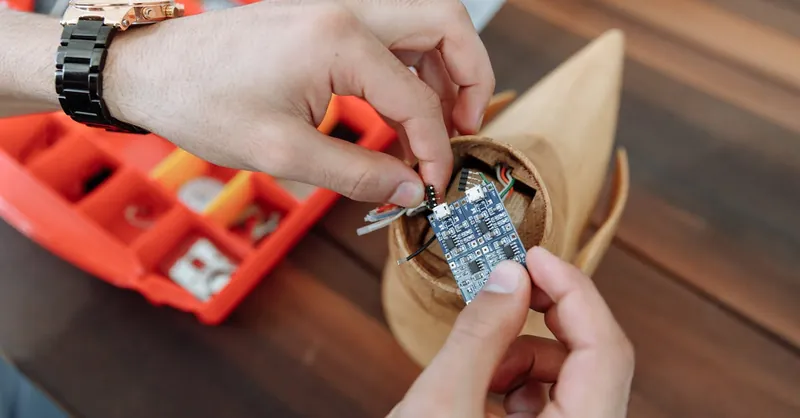
Image courtesy of Thirdman
Troubleshooting Boot and Power Issues: Diagnosing No Boot, Frequent Resets, or Power Instability
One of the most frustrating challenges in Raspberry Pi hardware projects is when the system fails to boot, restarts unexpectedly, or exhibits power instability. These symptoms often point to underlying issues with the power supply, voltage regulation, or hardware faults on the board or connected peripherals. Understanding how to systematically diagnose and fix these problems can save hours of troubleshooting and help you maintain a stable development environment.
Common Causes of Boot Failures and Power Instability
- Inadequate or Unstable Power Supply
The Raspberry Pi requires a clean, stable 5V power source capable of delivering sufficient current (typically at least 2.5A for newer models). Using a power supply with insufficient amperage or voltage fluctuations often leads to: - Failure to boot (no rainbow splash screen)
- Frequent and random reboots or shutdowns
-
Under-voltage warnings in the system log (
dmesg) or on-screen displays -
Faulty or Poor Quality USB Power Cables
Thin or damaged USB cables can cause voltage drops due to high resistance, resulting in the Pi not receiving adequate power despite a good power brick. Always use high-quality, short, thick-gauge cables rated for the required current to prevent this issue. -
Peripheral Overload on 5V or 3.3V Rails
Connecting multiple sensors, HATs, or modules that draw more current than the Raspberry Pi’s onboard voltage regulators can supply may cause voltage dips and resets. It’s essential to: - Calculate total current draw of all devices
-
Use externally powered USB hubs or separate regulated supplies for high-power peripherals
-
SD Card or Boot Media Issues
Corrupted or poorly imaged SD cards can cause the Raspberry Pi to hang during boot or restart repeatedly. Power issues can exacerbate this symptom by corrupting the file system.
Practical Checks and Fixes for Boot and Power Problems
-
Measure Voltage at Key Points
Use a multimeter to check the voltage at the USB power input, the 5V and 3.3V GPIO pins during boot attempt. Voltage below 4.8V at any point indicates a power delivery problem. -
Observe Power LED and ACT LED Behavior
The Raspberry Pi’s red power LED indicates power presence; if off or flickering, the power supply or connection is suspect. The green ACT LED provides clues on boot progress—no blinking usually means boot code is not loading. -
Use a Known-Good Power Supply and Cable
Swap out your power source and cable for a verified high-quality setup to isolate power-related causes. -
Disconnect Non-Essential Peripherals
Remove all HATs, USB devices, and sensors, then try booting with minimal hardware to identify if a peripheral causes excessive power draw or shorts. -
Check for Short Circuits or Damage on the PCB
Visually inspect the Raspberry Pi board for solder bridges, damaged components, or signs of overheating that could introduce faults affecting power delivery.
By systematically applying these practical diagnostics—focusing on power supply integrity, cable quality, and peripheral load management—you can effectively resolve most boot and power-related Raspberry Pi hardware issues. Remember that stable power and clean boot media are the foundations for reliable Raspberry Pi operation and smooth progression in your microcontroller projects.
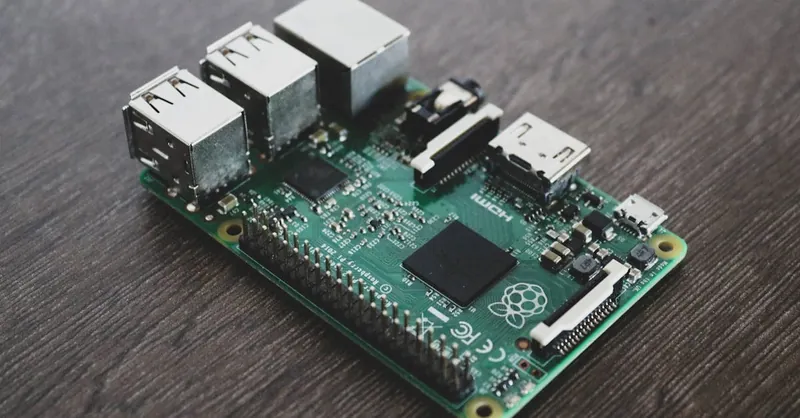
Image courtesy of Alessandro Oliverio
Debugging Sensor and Peripheral Failures: Verifying Sensor Output and Communication Buses
When a Raspberry Pi sensor or peripheral fails to respond as expected, effectively diagnosing the issue requires a combination of software and hardware diagnostic techniques focused on verifying sensor outputs and communication buses like I2C and SPI. Sensor failures often stem not only from connection problems but also from misconfigured protocols or subtle hardware faults, making a systematic approach essential for reliable troubleshooting.
Techniques to Verify Sensor Output
-
Validate Sensor Power and Ground Connections
Confirm that every sensor or peripheral has a stable and correct power supply (commonly 3.3V or 5V) and a proper ground reference. Use a multimeter to measure voltage at the device pins before proceeding. Sensors powered at incorrect voltages may malfunction or get permanently damaged. -
Check Raw Sensor Output Signals
For analog sensors, use an oscilloscope or multimeter to read output voltages directly at the sensor terminals, ensuring signals change appropriately with environmental conditions. For digital sensors, monitor GPIO pins configured as inputs to verify signal transitions or state changes. -
Monitor Sensor Data via Software
Utilize sensor-specific libraries or generic GPIO libraries in Python or C/C++ to read raw data registers. Confirm you can successfully initialize the sensor and retrieve plausible values. Inconsistent or fixed readings often indicate communication or sensor faults.
Diagnosing I2C and SPI Bus Communication
-
Detect Connected Devices on I2C Bus
Runi2cdetecton the Raspberry Pi to scan for active I2C device addresses. Missing expected addresses suggest wiring errors, incorrect pull-up resistors, or device power problems. Be cautious of address conflicts if multiple devices share the bus. -
Analyze Signal Integrity on I2C and SPI Lines
Use a logic analyzer or oscilloscope to probe the clock (SCL/SCK), data (SDA/MOSI, MISO), and chip select lines. Look for clean, stable waveforms without excessive noise, glitches, or timing violations. Poor signal quality often results from long cables, inadequate pull-up resistors (for I2C), or electrical interference. -
Verify SPI Mode and Clock Settings
SPI devices require matching clock polarity, phase, and speed between the Raspberry Pi and peripheral. Cross-check device datasheets and your SPI configuration to avoid miscommunication. Test SPI data transfer using simple read/write commands to confirm responsiveness. -
Use Diagnostic Software and Logging
Enable verbose logging or debug output in sensor libraries to capture error codes or timeout events that reveal protocol-level communication issues. Applications likespidev_testor custom scripts with extensive error handling help isolate software vs. hardware faults.
Hardware Diagnostics for Device Communication
-
Check Pull-up Resistors on I2C Lines: The I2C bus requires proper pull-up resistors (typically 4.7 kΩ) on both SDA and SCL lines. Absence or incorrect values can cause bus hangs or missed data. Confirm resistor presence with a multimeter or circuit schematic.
-
Inspect Physical Connectors and Wiring: Repeatedly faulty sensor communication is often due to loose, corroded, or swapped image pins. Inspect connectors and use continuity tests to verify wiring matches the pinout exactly.
-
Isolate Faulty Components: Temporarily disconnect all but one peripheral on shared buses to identify problematic devices. Substitute known-good sensors or modules to rule out hardware defects.
By combining these software checks with hardware signal analysis and power verification, you gain a comprehensive view of sensor and peripheral health. This integrated diagnostic approach not only accelerates troubleshooting but also enhances your understanding of Raspberry Pi embedded systems, ultimately contributing to more resilient and accurate sensor interfacing in your projects.

Image courtesy of ThisIsEngineering
Serial and Debug Console Usage: Leveraging UART and Serial Outputs for Low-Level Hardware Insight
For embedded hardware debugging on the Raspberry Pi, UART (Universal Asynchronous Receiver/Transmitter) interfaces and serial consoles provide invaluable low-level visibility into system behavior during boot, runtime, and fault conditions. Unlike high-level debugging, serial debugging taps directly into the hardware’s communication channels, allowing you to monitor kernel boot messages, kernel panics, and debug prints from your firmware or software running on the Pi or connected microcontrollers. Mastering serial console operations is crucial for diagnosing elusive hardware problems that don’t manifest as straightforward errors.
Understanding UART and Serial Console Basics on Raspberry Pi
The Raspberry Pi features dedicated UART pins on its GPIO header (commonly GPIO14 (TX) and GPIO15 (RX)) which can be configured for serial communication at various baud rates (usually 115200 baud by default). By connecting these pins to a USB-to-serial converter or another microcontroller’s UART, you can relay console output and debug data in real-time. This enables you to:
- Receive bootloader and kernel messages that indicate hardware initialization status and early boot faults.
- Access low-level system logs and error codes that often don’t appear in the graphical interface or standard logs.
- Execute command-line interaction with the Raspberry Pi remotely, useful when network or display issues prevent direct access.
- Debug connected microcontroller projects by monitoring their serial debug outputs synchronously with Raspberry Pi operation, facilitating cross-device troubleshooting.
Effective Usage of UART Serial Debugging
-
Enable Serial Console Access on the Raspberry Pi
Useraspi-configor manual edits to/boot/config.txtand/boot/cmdline.txtto enable and configure the serial console. Proper configuration avoids conflicts with the Bluetooth module using the primary UART on models such as the Pi 3 and 4. -
Connect Using a Reliable USB-to-Serial Adapter
A level-shifting USB-to-TTL serial cable (e.g., based on the FTDI or CH340 chip) is required to safely interface the Pi’s 3.3V UART pins with your PC’s USB port, preventing damage and ensuring signal integrity. -
Launch a Serial Terminal Program
Use tools like minicom, PuTTY, or screen on Linux/macOS or Windows to communicate with the Pi’s serial console, set at the correct baud rate (commonly 115200, 8N1). Logging can capture boot diagnostics or ongoing debug prints for offline examination. -
Incorporate Serial Debug Print Statements in Firmware
When writing embedded C/C++ or Python code interfacing with peripherals, adding strategic serial print statements helps trace execution paths, variable states, or sensor readings without halting the system, providing near real-time feedback on hardware interactions. -
Use Serial Debugging for Boot Failures and Kernel Panic Analysis
If your Raspberry Pi fails to boot or shows a black screen, serial console messages often reveal underlying causes such as missing device trees, driver loading errors, or hardware faults, which standard HDMI or SSH access won’t show.
Benefits of Serial Debug Console in Hardware Debugging
- Non-Intrusive Monitoring: Serial consoles provide continuous, low-overhead monitoring without altering system behavior or requiring complex hardware probes.
- Early Boot Diagnostics: Unlike SSH or graphical interfaces, serial output begins immediately after power-on, exposing bootloader and kernel initialization steps.
- Cross-Device Debugging Capability: UART serial debugging enables synchronized troubleshooting when multiple microcontrollers and sensors are involved, improving root cause analysis for hardware interaction faults.
By integrating UART serial console debugging into your Raspberry Pi hardware troubleshooting toolbox, you gain an essential low-level perspective on your system’s operation. This approach dramatically improves your ability to detect hardware initialization issues, communication errors, and unexpected resets—common challenges in complex Raspberry Pi and microcontroller projects—thus accelerating your path to stable, reliable embedded systems development.

Image courtesy of Craig Dennis
Software-Hardware Integration Debugging: Identifying Drivers, Code Bugs, and Hardware Malfunctions
In Raspberry Pi hardware projects, many issues arise at the intersection of software and hardware layers, making it crucial to differentiate whether a fault originates from device drivers, application code bugs, or physical hardware malfunctions. This integrated debugging approach helps prevent misdirected efforts and speeds up resolution by targeting the root cause precisely.
Key Strategies to Diagnose Software-Hardware Interaction Issues
- Isolate the Problem Domain Early
- Test hardware independently using simple, known-good code snippets (e.g., blinking an LED or reading sensor data via minimal scripts) to confirm physical components are functional.
-
If hardware works as expected in isolation, shift focus to the software stack—drivers, libraries, and your custom code.
-
Validate Driver and Firmware Compatibility
- Ensure you're using correct, up-to-date drivers compatible with your Raspberry Pi model and OS version. Incompatible or outdated drivers often cause peripherals to malfunction or behave erratically.
-
For kernel-level device drivers, check dmesg logs or system journal entries to detect driver registration failures or hardware initialization errors.
-
Perform Incremental Code Testing
- Break down your application code into smaller testable units, verifying each function’s expected output in isolation.
- Leverage debug print statements and logging mechanisms to trace data flow and detect logic errors or incorrect hardware commands.
-
For Python projects, tools like pdb enable step-through debugging to pinpoint software bugs affecting hardware communication.
-
Monitor Hardware Status via Software Feedback
- Utilize return codes, status registers, or bus error flags exposed by drivers or peripheral APIs to identify communication failures or hardware faults systematically.
-
Observe software timeouts or exceptions that could indicate stalled hardware responses or electrical glitches.
-
Cross-Verify with Hardware Diagnostic Tools
- Correlate software-reported errors with physical measurements such as voltage readings, signal integrity checks (via an oscilloscope), or logic analyzer captures to confirm whether hardware signals behave as the software expects.
-
This two-pronged approach ensures you don’t chase ghost software bugs when physical wiring or component faults are to blame.
-
Consider Environmental and Power Factors
- Since hardware faults often manifest as intermittent software errors, consider testing under various power conditions or shielding to rule out voltage drops, noise, or temperature effects.
By systematically applying these strategies, you transform the complex task of software-hardware integration debugging into a manageable, logical workflow. This not only enhances your capability to discern driver issues, coding errors, or hardware failures, but also builds expertise that elevates the reliability and robustness of your Raspberry Pi projects. Consistent practice in this area will empower you to troubleshoot embedded systems effectively, reducing downtime and accelerating development cycles.

Image courtesy of Craig Dennis
Firmware and Embedded Systems Debugging: Approaches for Raspberry Pi Compatible Microcontrollers
Debugging embedded firmware on Raspberry Pi compatible microcontrollers presents unique challenges that go beyond standard software troubleshooting. These microcontrollers often run bare-metal or real-time operating systems, closely interfacing with hardware peripherals, which means that debugging requires specialized strategies focused on low-level firmware behavior, timing issues, and hardware-software synchronization.
Core Concepts for Effective Embedded Firmware Debugging
- Utilize On-Chip Debugging Interfaces
Most Raspberry Pi-compatible microcontrollers (such as those in the RP2040 series) support Serial Wire Debug (SWD) or JTAG interfaces. These enable real-time debugging with features like: - Setting breakpoints at the firmware instruction level
- Single stepping through code execution
- Inspecting register states and peripheral configurations
-
Monitoring memory and stack usage dynamically
Employing a compatible debug probe (e.g., Raspberry Pi Debug Probe, Segger J-Link) is essential for harnessing these capabilities. -
Incorporate Logging and Assert Mechanisms in Firmware
Because debugging embedded firmware often involves limited visibility into runtime states, embedding serial debug logs via UART or USB CDC can provide crucial insights into firmware execution flow and peripheral status. Additionally, using assert statements to catch invalid states or unexpected behaviors early prevents prolonged faults that are harder to analyze post-mortem. -
Leverage Hardware Abstraction Layer (HAL) Drivers and Peripheral Libraries
Debugging becomes more manageable when code is layered and modular. Utilizing and verifying the stability of trusted HAL drivers for peripherals (GPIO, ADC, I2C, SPI, timers) reduces guesswork related to hardware initialization and configuration bugs. When modifying low-level peripheral code, incremental testing is vital to pinpoint issues accurately. -
Implement Unit Testing and Continuous Integration for Firmware
Advanced embedded projects benefit significantly from developing unit tests targeting sensor drivers, protocol stacks, and core logic inside the firmware. Automating these tests in a continuous integration (CI) pipeline, even via host-based simulators, accelerates error detection before deployment on Raspberry Pi hardware.
Specific Debugging Techniques for Embedded Firmware on Raspberry Pi Microcontrollers
-
Memory and Stack Analysis:
Monitoring stack overflow and heap fragmentation is critical, as these issues often cause erratic behavior or resets in embedded systems. Tools like stack canaries and memory usage monitors integrated in firmware help preempt these faults. -
Real-Time Trace and Profiling:
Where supported, using trace features like ETM (Embedded Trace Macrocell) provides a cycle-accurate execution history, allowing developers to identify timing bottlenecks, ISR conflicts, or peripheral latency that disrupt correct operation. -
Fault and Exception Handling:
Robust firmware sets up handlers for faults (hard faults, bus faults) that capture diagnostic data such as fault addresses and CPU register contents. Analyzing these exceptions with debug interfaces often reveals hardware misconfigurations or software errors. -
Power and Clock Configuration Verification:
Misconfigured clock sources, PLLs, or power modes cause subtle failures such as incorrect peripheral timing or unexpected resets. Debugging firmware requires validating clock tree setup and ensuring voltage scaling aligns with performance demands.
Incorporating these firmware-centric debugging methodologies equips you with the skills to tackle complex embedded issues on Raspberry Pi microcontrollers. Mastering these approaches not only leads to more reliable and performant projects but also deepens your understanding of the intricate interaction between software and hardware in embedded systems development.
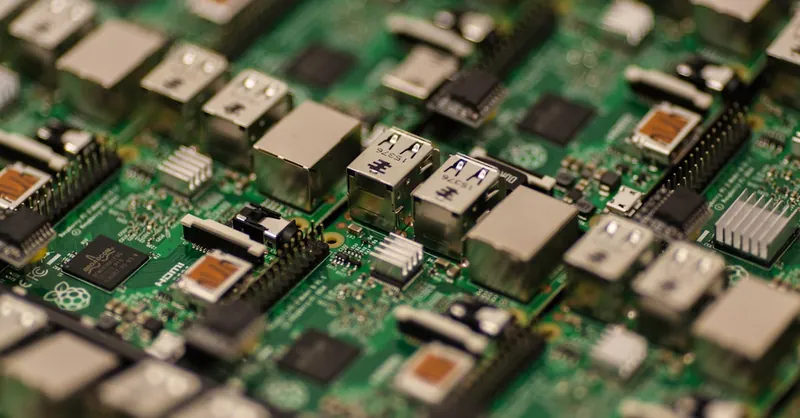
Image courtesy of Craig Dennis
Advanced Diagnostics with Logic Analyzers: Deep Debugging of Digital Signals and Communication Protocols
When Raspberry Pi hardware projects involve complex digital interactions, logic analyzers and protocol sniffers become indispensable tools for advanced diagnostics. These devices capture multiple digital signals simultaneously, decoding the intricate timing and data exchanges on communication buses such as I2C, SPI, and UART, enabling you to identify faults beyond the reach of simpler multimeters or oscilloscopes.
Why Use Logic Analyzers in Raspberry Pi Hardware Debugging?
Logic analyzers provide precise, time-correlated views of all digital lines in your project, revealing subtle issues like signal glitches, protocol violations, or missed acknowledgments that often cause intermittent or persistent hardware failures. Unlike oscilloscopes, which focus on voltage waveforms on one or two channels, logic analyzers scale to tens or even hundreds of channels, making them ideal for multi-signal protocols or parallel bus inspection.
Key Benefits for Raspberry Pi Projects
- Protocol Decoding and Visualization: Automatically interpret and display protocol transactions for buses like I2C, SPI, UART, CAN, and more, letting you quickly spot invalid data packets, missing start/stop conditions, or timing deviations.
- Timing Analysis Across Signals: Examine the precise timing relationships between signals—for instance, correlating a microcontroller’s output pin toggling with the corresponding data clock on an SPI bus to confirm synchronization.
- Capturing Intermittent and Transient Faults: Logic analyzers trigger on complex conditions and capture long data sequences, invaluable for diagnosing sporadic communication failures or race conditions in embedded designs.
Applying Logic Analyzer Diagnostics Effectively
-
Connect Probes to Relevant GPIO Pins
Attach your logic analyzer leads to the GPIO pins involved in the communication bus or digital signals under scrutiny, ensuring proper grounding and signal integrity to avoid introducing noise. -
Configure Trigger Conditions and Sampling Rates
Set appropriate trigger conditions—such as a specific start condition on an I2C bus or a falling edge on a chip select line—to capture relevant data efficiently. Choose a sampling rate at least 5-10 times faster than the highest bus speed to ensure faithful signal reconstruction. -
Use Protocol Decoding Software
Leverage open-source or commercial software (e.g., Sigrok PulseView, Saleae Logic software) that interfaces with your logic analyzer to decode and display data frames, error flags, and timing diagrams in user-friendly formats. This transforms raw binary captures into actionable insights. -
Analyze Captured Data for Anomalies
Review captured waveforms to identify: - Missing acknowledgments or corrupted data packets on I2C or SPI
- Incorrect baud rates or framing errors on UART
-
Unexpected glitches or timing violations causing communication faults
-
Correlate with Raspberry Pi Software Behaviors
Correlate timing and data from the logic analyzer with Raspberry Pi firmware logs or error messages. For example, a failed I2C read operation in your Python code might align with an incomplete acknowledgment pulse shown on the analyzer, confirming a hardware-level fault.
Enhancing Debugging Productivity
- Integrate Logic Analyzer Use Early in Development: Capturing baseline “healthy” communication traces before project deployment provides a valuable reference for comparison during later troubleshooting.
- Combine with Oscilloscope Measurements: Use oscilloscopes for analog signal integrity and noise analysis while employing logic analyzers for protocol validation, gaining comprehensive hardware insight.
- Document Findings and Reproduce Issues Reliably: The ability to save and share captured logic analyzer data enhances team collaboration and accelerates community support when troubleshooting complex hardware interactions.
Incorporating logic analyzers and protocol sniffers into your Raspberry Pi hardware debugging arsenal elevates your ability to detect elusive digital communication errors and signal integrity issues. Mastery of these diagnostic tools empowers you to build more reliable, efficient, and sophisticated Raspberry Pi embedded projects, ultimately reducing development cycles and boosting project success.

Image courtesy of Markus Spiske
Preventive Tips and Best Practices: Structuring Your Raspberry Pi Hardware Projects for Minimal Debugging and Maximum Reliability
Designing your Raspberry Pi hardware projects with preventive strategies and best practices from the outset significantly reduces debugging time and enhances overall system stability. By applying sound project structuring principles, you can avoid common pitfalls like intermittent hardware faults, communication errors, and power instabilities that often lead to lengthy troubleshooting sessions.
Key Preventive Practices to Minimize Hardware Debugging Efforts
-
Plan Clear and Modular Circuit Designs
Break your project into well-defined, modular blocks (e.g., power distribution, sensor arrays, communication interfaces). This compartmentalization not only streamlines development but also simplifies isolating faults during testing by narrowing down problematic sections. -
Use Standardized Wiring and Connectors with Proper Pin Labeling
Consistently use color-coded wires, high-quality dupont connectors, or custom PCBs with clearly labeled pins. Document your wiring schematics thoroughly to prevent connection errors that are among the most frequent debugging headaches. -
Implement Robust Power Management
Design the power delivery system to include: - Stable, regulated power supplies with adequate current capacity
- Protective components like fuses, diodes, and capacitors for noise filtering and transient suppression
-
Separate power domains for sensitive sensors or high-current devices to avoid voltage dip issues
-
Add Test Points and Diagnostic Access
Incorporate easily accessible test points on critical signals (e.g., I2C lines, GPIO pins, power rails) for quick voltage and signal checks using multimeters or oscilloscopes. This foresight expedites fault identification without disassembling your entire build. -
Use Pull-up/Pull-down Resistors Properly
Design the circuit schematic with correctly valued pull-up or pull-down resistors on input lines and communication buses like I2C to maintain reliable signal levels and prevent bus contention issues. -
Adopt Incremental Development and Testing
Build your project in stages, validating each hardware and software component individually before integration. This practice helps detect hardware flaws early and ensures software functions align with hardware behavior, reducing compounded debugging complexity. -
Leverage Protective Hardware Features and Safeguards
Integrate reverse polarity protection, ESD protection, and current limiting where applicable to shield your Raspberry Pi and peripherals from accidental damage, which often results in erratic hardware malfunctions difficult to diagnose. -
Maintain Clean, Organized Workspace and Documentation
Keep your components, tools, and documentation orderly. Clear versioning of code, hardware revisions, and wiring diagrams allows reproducibility and easier handoff or review when tackling debugging challenges collaboratively.
Benefits of Early Preventive Structuring for Raspberry Pi Projects
By embedding these preventive tips and best practices into your project’s foundation, you cultivate a resilient hardware design that minimizes common error sources. This approach delivers:
- Reduced debugging time through clearer fault localization
- Higher reliability and repeatability in sensor readings and peripheral interactions
- Simplified maintenance and future upgrades by having well-documented, modular systems
- Enhanced safety and component longevity by proactively managing power and signal integrity
Embracing preventive design and disciplined project management ultimately transforms your Raspberry Pi hardware development experience—shifting from reactive troubleshooting to confident, proactive engineering success.
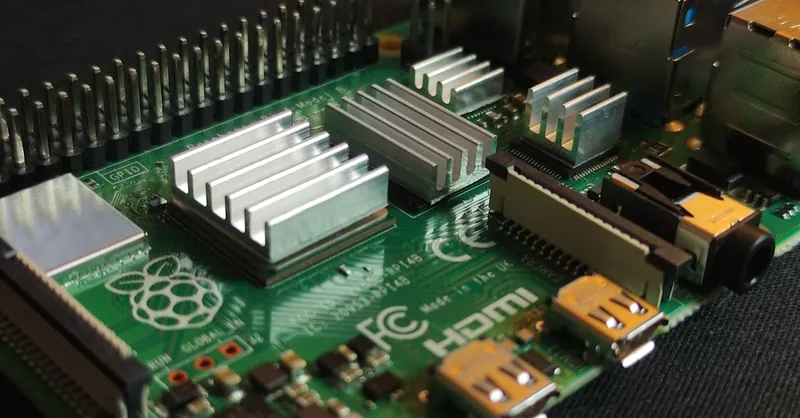
Image courtesy of Mathias Wouters