Effective C/C++ Debugging Techniques for Embedded Systems
Category: Embedded Systems
Master C/C++ Debugging for Your Embedded Projects
Debugging embedded systems running C or C++ code can be a daunting task, especially when working with limited hardware resources and complex hardware-software interactions. If you’re a tech enthusiast, hobbyist, or developer who programs Raspberry Pi or microcontrollers, you’ve likely faced the frustration of elusive bugs, obscure crashes, or unexpected hardware behavior that standard debugging techniques can’t easily resolve. This post is crafted specifically for you — whether you’re just getting started with embedded development or looking to deepen your debugging toolkit. We’ll cut through the noise and deliver practical techniques focused on embedded C/C++ debugging, covering tools, workflows, and common pitfalls. Our approach is both comprehensive and accessible, blending well-known methods with tips tailored to embedded constraints. By the end, you’ll learn how to diagnose and fix bugs more efficiently, saving time and reducing trial-and-error cycles. This post stands apart by focusing exclusively on embedded systems’ specific challenges including limited visibility, real-time constraints, and hardware interaction debugging. Ready to unlock a smoother debugging experience and elevate your project success? Keep reading — the insights here will equip you to conquer embedded C/C++ bugs with confidence and precision.
- Master C/C++ Debugging for Your Embedded Projects
- Understanding the Unique Challenges of Debugging Embedded C/C++ Systems
- Setting Up Your Development Environment for Embedded C/C++ Debugging
- Using Hardware Debuggers (JTAG, SWD) for Effective Embedded C/C++ Debugging
- Serial Debugging and Logging Techniques for Embedded C/C++ Systems
- Understanding and Utilizing Core Dumps and Fault Handlers in Embedded C/C++ Debugging
- Using Simulators and Emulators for Early Debugging in Embedded C/C++ Development
- Debugging Memory Issues in Embedded Systems: Detecting Stack Overflows and Memory Leaks
- Static Code Analysis and Automated Testing Tools – Improving Code Quality in Embedded C/C++
- RTOS-Specific Debugging Approaches: Tackling Multi-Threaded Embedded Applications
- Best Practices and Tips for Efficient Debugging Workflow in Embedded C/C++
Understanding the Unique Challenges of Debugging Embedded C/C++ Systems
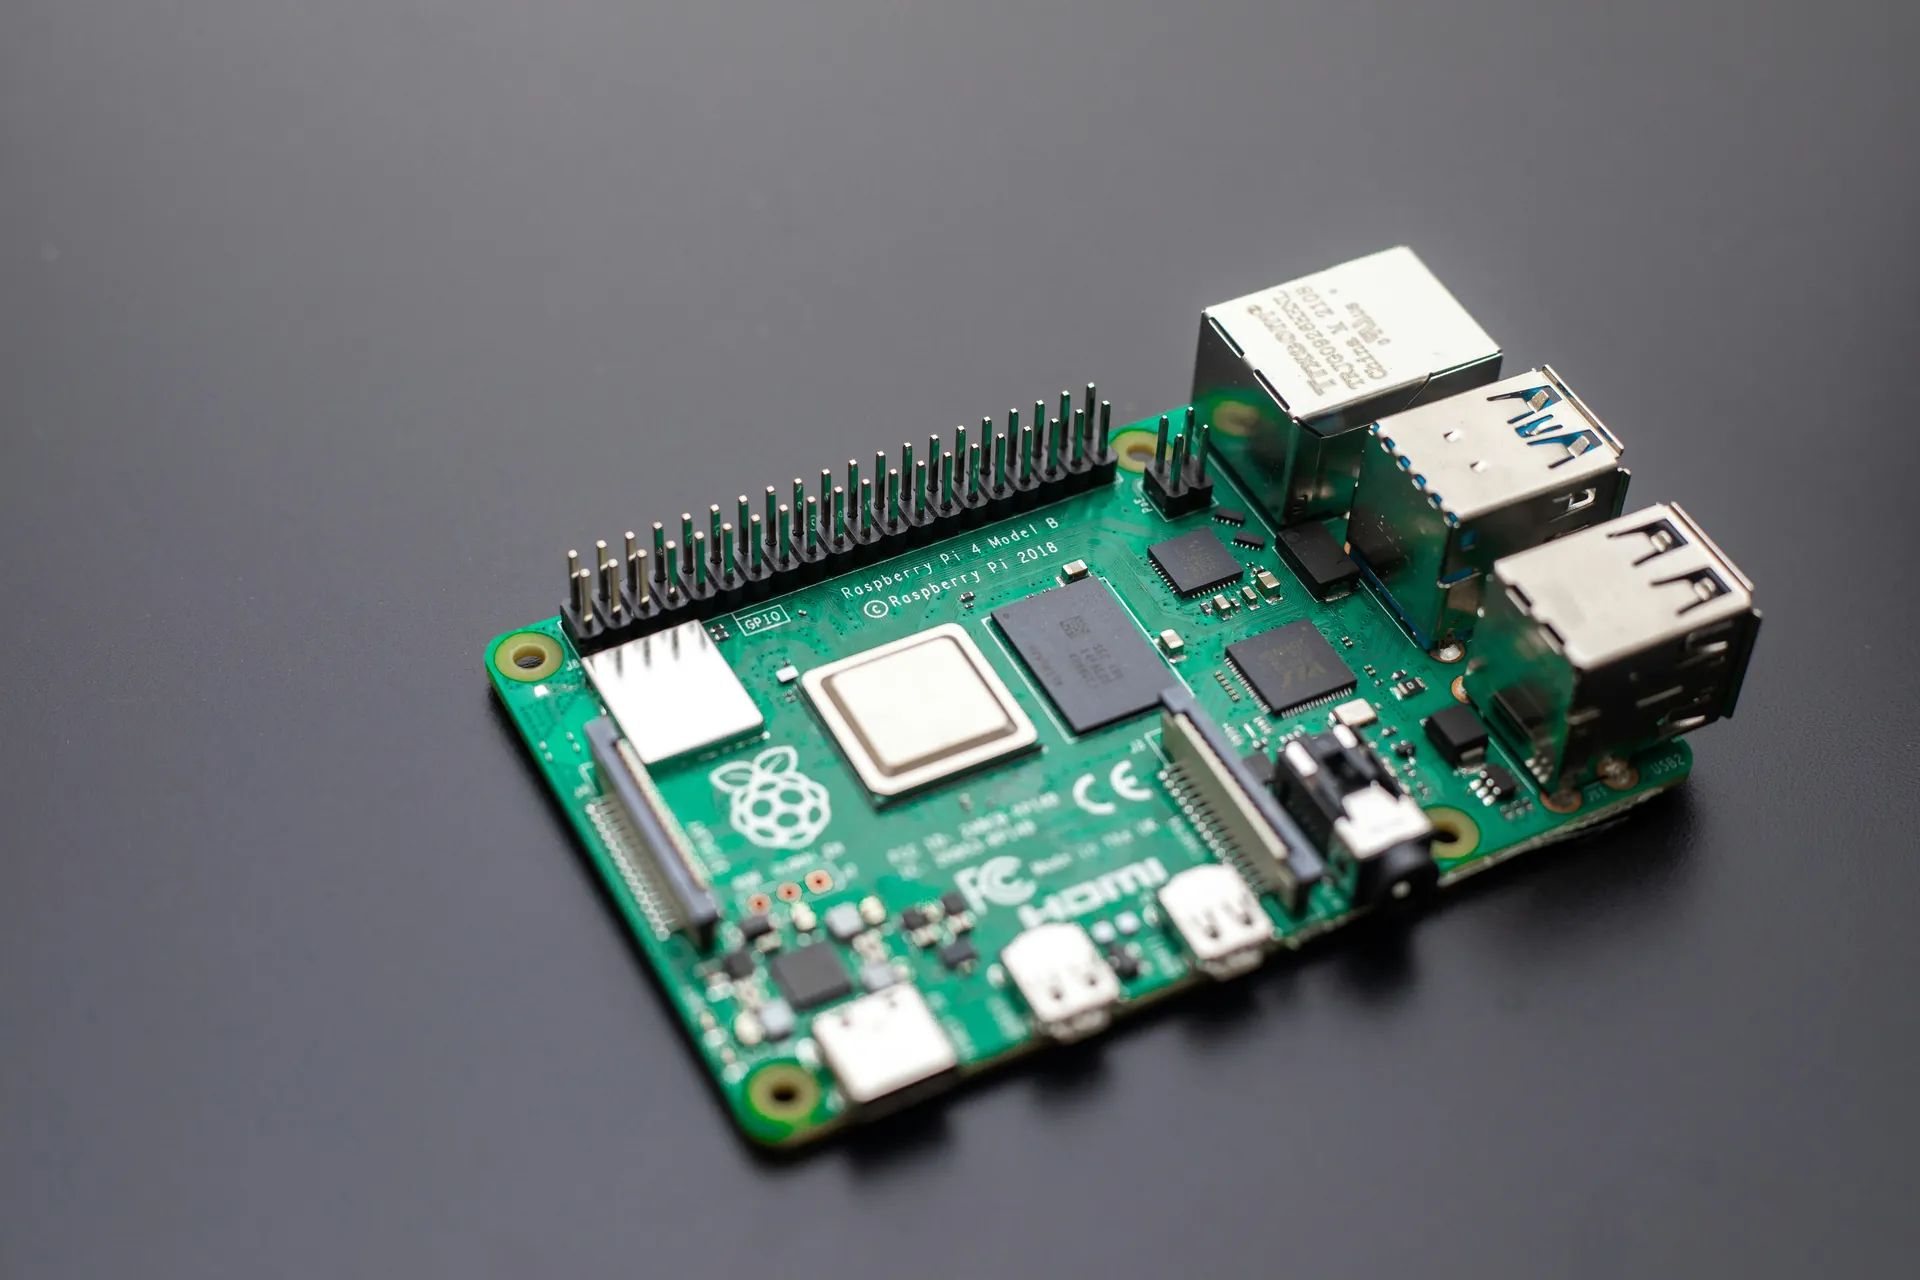
Debugging embedded C/C++ systems presents a set of unique challenges that differ significantly from debugging desktop or server applications. One of the primary hurdles lies in the hardware constraints typical of embedded environments. Microcontrollers and Raspberry Pi-like single-board computers often have limited CPU processing power, restricted RAM, and constrained non-volatile storage. These resource limitations mean that traditional debugging techniques, such as heavy instrumentation or verbose logging, can introduce unacceptable overhead or even distort system behavior, making bug isolation much harder.
Another critical challenge is meeting real-time requirements. Many embedded systems operate in environments where timing is crucial—delays or missed deadlines can lead to system failures or unsafe conditions. This real-time nature restricts intrusive debugging methods that might slow code execution or alter timing, forcing developers to rely on lightweight, non-intrusive tools. Additionally, the limited debugging visibility inherent in embedded development complicates root cause analysis. Unlike general-purpose computers, embedded devices often lack rich user interfaces or console outputs, and hardware peripherals may interact in complex ways unseen from software layers. This limited observability demands specialized debugging strategies, such as the use of hardware debuggers (JTAG/SWD), trace analyzers, and logic analyzers, in combination with carefully designed diagnostic code, in order to gain accurate insight into program execution and hardware interactions. Understanding these challenges upfront is essential to developing effective debugging strategies tailored for embedded C and C++ projects.

Image courtesy of Pixabay
Setting Up Your Development Environment for Embedded C/C++ Debugging
A well-configured development environment is fundamental to effective debugging in embedded C and C++ projects. The right setup not only accelerates your troubleshooting process but also helps you catch bugs early, improving overall code quality and system stability. Essential components include cross-compilers, integrated development environments (IDEs) with embedded debugging support, and properly configured debug builds tailored for your target hardware.
Cross-Compilers: Building for Your Target Architecture
Since embedded systems rarely run on the same architecture as your development PC, a reliable cross-compiler is indispensable. Cross-compilers translate your C/C++ source code into machine code compatible with microcontrollers or single-board computers like Raspberry Pi. Popular options include:
- GCC-based toolchains such as arm-none-eabi-gcc for ARM Cortex devices or Raspberry Pi Pico’s toolchain.
- Vendor-specific compilers like Microchip MPLAB XC or TI Code Composer Studio for specialized hardware.
- Open-source options like Clang/LLVM, increasingly supported for embedded targets.
Choosing the right cross-compiler ensures your code builds correctly and optimizations align with your system’s constraints, which is vital for maintaining debuggability.
IDEs with Embedded Debugging Support
Integrated development environments streamline coding, compiling, flashing, and debugging in one interface. Look for IDEs that natively support embedded debugging protocols (e.g., JTAG, SWD), breakpoint management, and variable inspection.
- Visual Studio Code combined with extensions like Cortex-Debug provides a flexible and popular environment.
- Eclipse-based IDEs like STM32CubeIDE or MCUXpresso offer rich debugging tools and peripheral views tailored for microcontrollers.
- Commercial options such as Segger Embedded Studio or IAR Embedded Workbench deliver advanced debugging features with tight hardware integration.
Using an IDE with integrated debugging support simplifies setting up debugging sessions and interpreting low-level data, saving critical development time.
Configuring Debug Builds for Maximum Insight
To enable effective debugging, configuring your project’s build settings properly is crucial. Consider the following best practices:
- Enable debugging symbols by compiling with flags like
-g(GCC) to retain variable and function information. - Disable aggressive optimizations (
-O0or minimal optimization levels) during debugging builds to prevent instruction reordering that complicates breakpoint handling. - Use conditional compilation and preprocessor directives to insert debug-specific code without impacting release builds.
- Configure linker scripts and memory layouts carefully to reflect your target hardware and preserve symbol information.
A debug build configured with these considerations ensures the debugger can provide accurate runtime data and control, making bug hunting more precise and less time-consuming.
By assembling these essential tools—cross-compilers aligned with your hardware, IDEs with embedded debugging capabilities, and well-tuned debug builds—you build a solid foundation for advanced embedded C/C++ debugging workflows and boost your project’s success rate.

Image courtesy of luis gomes
Using Hardware Debuggers (JTAG, SWD) for Effective Embedded C/C++ Debugging
When debugging embedded C/C++ code, especially on microcontrollers and Raspberry Pi projects, hardware debuggers like JTAG (Joint Test Action Group) and SWD (Serial Wire Debug) are invaluable tools. These interfaces provide deep insight into your running system, letting you pause execution, inspect and modify variables in real-time, and step through code instruction-by-instruction—all without relying on intrusive software instrumentation.
Connecting Your Hardware Debugger
Setting up JTAG or SWD involves physically connecting the debugger hardware to your embedded target’s debug port. Common steps include:
- Identify Debug Pins: Consult your microcontroller or SBC documentation to locate the JTAG or SWD pins—these typically include clock, data, reset, and ground signals.
- Use Compatible Debugger Hardware: Popular debuggers include Segger J-Link, ST-Link, and DAPLink adapters, each supporting ARM Cortex devices via SWD or JTAG.
- Connect to Your PC IDE: Via USB, your debugger interfaces with the IDE or debugging software on your PC, bridging control between your host machine and embedded target.
- Power the Target Board: Ensure your embedded device is powered either through the debugger (if supported) or an independent supply to allow stable debugging sessions.
Many IDEs and debugging tools automatically detect the target device via these hardware connections, facilitating seamless setup.
Utilizing Breakpoints and Watch Variables
Once connected, you can leverage essential debugging features to control program flow and monitor internal state:
-
Breakpoints: Set breakpoints directly in your source code to pause execution at critical points—this allows inspection of registers, memory, and variable values. Hardware breakpoints supported by JTAG/SWD impose minimal runtime overhead, ideal for real-time embedded systems.
-
Watch Variables: Monitor specific variables or memory addresses dynamically. Watchpoints trigger a breakpoint when a watched variable changes, helping catch subtle bugs like unexpected value modifications or buffer overruns.
Single-Stepping Through Embedded Code
Single-stepping enables granular control to understand exactly how your code executes step-by-step:
- Step Into: Executes the next line of code, entering called functions.
- Step Over: Executes the next instruction but skips stepping inside function calls.
- Step Out: Runs until the current function returns, resuming higher-level execution.
Single-stepping through embedded code via JTAG/SWD helps isolate problematic instructions, track pointer dereferences, and verify peripheral interactions in real-time. This fine-grained execution control is indispensable when debugging low-level hardware interactions or complex C/C++ logic in resource-constrained environments.
By mastering hardware debuggers and their capabilities—connecting your target via JTAG or SWD, applying breakpoints and watch variables, and using single-step execution—you dramatically enhance your ability to identify and resolve hidden bugs. This approach offers an accurate, efficient, and minimally intrusive method for embedded C/C++ debugging, bridging the gap between hardware behavior and software logic at the core of successful embedded system development.
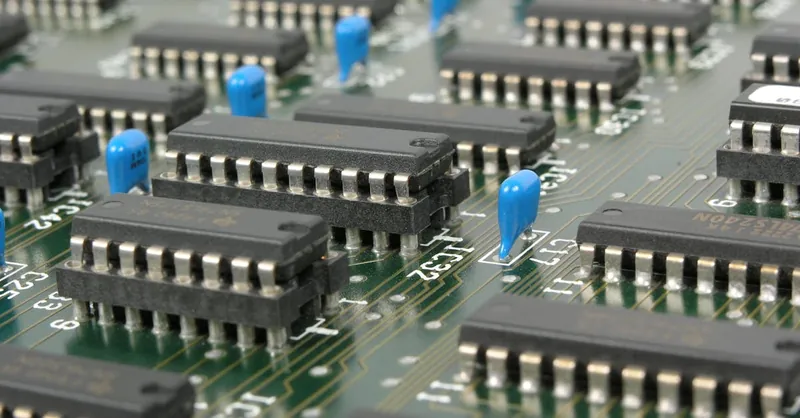
Image courtesy of Pixabay
Serial Debugging and Logging Techniques for Embedded C/C++ Systems
When hardware debuggers are not available or practical, serial debugging and logging over UART (Universal Asynchronous Receiver/Transmitter) provide a powerful alternative for gaining insight into embedded C/C++ program execution. UART-based debugging involves sending text-based messages or logs from your embedded device to a PC terminal or logging tool, enabling real-time monitoring of system status, variable values, and error conditions without intrusive breakpoints.
Implementing UART-Based Debugging
To implement UART debugging in embedded projects, you typically:
- Initialize the UART Peripheral on your microcontroller or SBC with appropriate baud rate and settings matching your PC terminal or serial monitor.
- Insert debug print statements in your C/C++ code using lightweight, low-overhead functions such as
printf()or custom wrappers, carefully positioned near critical logic or suspicious code paths. - Connect the UART interface via USB-to-serial converters or dedicated UART pins to a PC, enabling interaction through terminal programs like PuTTY, Minicom, or the Arduino Serial Monitor.
This technique is especially effective for tracking program flow and capturing runtime data in resource-constrained systems where blocking hardware breakpoints might cause timing issues or fail to capture transient faults.
Using printk-Style Logs for Embedded Development
Inspired by Linux kernel debugging, printk-style logging introduces structured, severity-tagged messages to embedded firmware, enhancing readability and filtering:
- Use different log levels such as DEBUG, INFO, WARN, ERROR to categorize messages.
- Implement ring buffers or circular logging in RAM to store recent logs, which can be dumped on demand over UART or saved for post-mortem analysis.
- Design macros like
LOG_DEBUG(),LOG_ERROR()to standardize messages and prevent cluttering release builds with debug code using conditional compilation guards (#ifdef DEBUG).
Handling Buffer Overflows and UART Limitations
Serial communication and logging come with limitations such as buffer size constraints and blocking delays:
- To prevent buffer overflows, allocate sufficient UART transmit buffers and employ non-blocking, interrupt-driven UART drivers that reduce the risk of data loss or system stalls.
- Implement flow control mechanisms (hardware RTS/CTS or software XON/XOFF) when supported by your hardware to manage data rates between your embedded system and the PC.
- Be mindful of logging overhead—excessive debug prints can disrupt real-time performance and timing-sensitive tasks. Use selective logging or dynamic log level control to minimize impact.
By integrating UART-based serial debugging and printk-style logging thoughtfully, embedded developers gain a highly accessible and real-time window into system behavior, complementing hardware debugging tools. These serial debugging best practices help uncover elusive bugs, track intermittent issues, and validate system correctness in C/C++ embedded projects—especially when other debugging modalities are limited or unavailable.

Image courtesy of luis gomes
Understanding and Utilizing Core Dumps and Fault Handlers in Embedded C/C++ Debugging
Capturing system states at the moment of a crash is crucial for diagnosing complex bugs in embedded C/C++ applications running on microcontrollers or Raspberry Pi platforms. Core dumps and fault handlers serve as powerful tools to record critical system information—such as CPU registers, stack traces, and memory contents—when an exception or fault occurs. Leveraging these mechanisms significantly enhances your ability to perform post-mortem analysis and pinpoint root causes that are otherwise difficult to reproduce or observe in real-time.
Configuring Fault Handlers for Reliable Crash Capturing
Embedded systems often encounter faults like hard faults, memory access violations, or bus errors. By implementing customized fault handlers within your firmware, you can intercept these fault conditions immediately. Best practices include:
- Registering fault handler routines (e.g., HardFault_Handler, MemManage_Handler) in your startup code or vector table.
- Capturing CPU state inside the handler, including program counter (PC), link register (LR), stack pointer (SP), and fault status registers.
- Storing context information in a reserved RAM area or non-volatile memory (such as EEPROM or flash) for retrieval after system reset.
- Optionally, triggering system resets or entering a safe recovery state while preserving dump data to avoid repeated faults.
These fault handlers transform unexpected system crashes from mysterious shutdowns into actionable events with rich diagnostic data.
Generating and Interpreting Core Dumps on Embedded Devices
Core dumps represent snapshots of the processor state and critical memory regions at crash time, enabling deep forensic debugging offline. To enable core dump functionality:
- Integrate a lightweight core dump generator within your embedded firmware, either from vendor SDKs or third-party libraries designed for resource-constrained environments.
- Define which memory regions and registers to capture, balancing thoroughness with memory footprint constraints.
- Utilize compression or checksum techniques to optimize storage of dump data.
- Securely transfer dump files to a host system via UART, USB, or network interfaces for analysis.
Once obtained, core dumps can be loaded into debugging tools such as GDB with appropriate symbols, facilitating inspection of variables, call stacks, and code paths that led to failure. Understanding register values around the faulted instruction often reveals the precise cause, whether it’s stack corruption, pointer errors, or peripheral misconfigurations.
Why Core Dumps and Fault Handlers Matter for Embedded Debugging
In embedded C/C++ development, many bugs manifest as transient faults or race conditions that do not reproduce under debugger control. Core dumps and fault handlers offer a non-intrusive, deterministic way to capture failure snapshots without halting system execution prematurely. This method is particularly valuable in headless devices or applications where real-time operation cannot be paused. By configuring and interpreting core dumps alongside fault handlers, developers unlock critical insights to accelerate debugging cycles, improve firmware robustness, and reduce costly downtime in embedded projects.
Mastering the setup and analysis of core dumps and fault handlers is a must-have skill in your embedded debugging toolkit, complementing hardware debuggers, serial logging, and IDE-based methods for a complete, resilient C/C++ troubleshooting strategy.

Image courtesy of Craig Dennis
Using Simulators and Emulators for Early Debugging in Embedded C/C++ Development
Before deploying your code to physical hardware, leveraging software simulators and emulators can substantially streamline the debugging process in embedded C/C++ projects. These tools mimic your target microcontroller or processor environment on a host computer, allowing you to catch and diagnose issues early in development without risking hardware damage or long flash-build cycles.
Benefits of Using Simulators and Emulators
- Early Bug Detection: Simulators execute your embedded code virtually, enabling early detection of logical errors, memory leaks, or incorrect peripheral configurations before hardware availability.
- Faster Iterations: Simulators avoid time-consuming flashing and rebooting of devices, speeding up the development loop and enabling instant code testing and breakpoint debugging in familiar IDE environments.
- Safe Testing Environment: Emulation protects your hardware from potential faults caused by buggy code, such as infinite loops or peripheral misconfiguration that could physically damage or brick your device.
- Peripheral and Register Visualization: Many simulators provide detailed views of internal registers, peripheral states, and memory buffers that may be difficult or impossible to access on physical hardware.
- Integration with Debuggers: Emulators often integrate with GDB or IDE debuggers, supporting single-step execution, watchpoints, and variable inspection with high granularity.
Limitations and Considerations
Despite their advantages, simulators and emulators have inherent limitations that developers must consider:
- Incomplete Hardware Modeling: Software simulators rarely capture 100% of peripheral behavior, timing nuances, or hardware interrupts found in real embedded systems, which may mask hardware-specific bugs.
- Performance Differences: Execution speed in simulators can vastly differ from real-time operation, potentially hiding race conditions or timing-related issues vital for embedded debugging.
- Limited Real-World Interaction: Simulations cannot fully replicate real-world inputs such as sensor data, signal noise, or unpredictable external events without extensive modeling effort.
- Resource Overheads: Advanced emulation environments can require significant host machine resources and setup complexity, which might be daunting for hobbyists or rapid prototyping.
Best Practices for Simulator and Emulator Use
- Use simulation extensively for logic validation, interface testing, and basic control flow debugging before moving to actual hardware.
- Combine simulator runs with hardware-in-the-loop (HIL) testing or real-world trials to validate timing, interrupts, and hardware-dependent features.
- Regularly verify that simulated peripheral behavior aligns with target datasheets and errata to avoid false assumptions.
- Keep fallback plans such as hardware debuggers and serial logging ready for issues that simulators cannot detect.
By integrating software simulators and emulators early in the embedded C/C++ debugging workflow, Raspberry Pi enthusiasts and microcontroller developers can reduce costly iteration cycles, catch subtle bugs sooner, and build more robust embedded applications. Understanding the benefits and limitations of these virtual debugging environments empowers you to balance efficiency with accuracy as you progress toward reliable embedded system development.

Image courtesy of Markus Spiske
Debugging Memory Issues in Embedded Systems: Detecting Stack Overflows and Memory Leaks
Memory management is a critical aspect of embedded C/C++ development, where limited RAM and deterministic behavior are paramount. Memory issues such as stack overflows, heap corruption, or memory leaks can lead to unpredictable crashes, data corruption, and system instability—often the hardest bugs to trace in embedded environments. Unlike desktop applications, embedded systems lack complex memory protection units (MPUs) or advanced OS-based memory diagnostics, necessitating specialized techniques and tools to reliably detect and resolve memory faults.
Detecting Stack Overflows in Embedded Systems
The stack in embedded devices is typically small and fixed in size, making stack overflow detection a top debugging priority. Common causes include deep recursion, large local variable allocation, or interrupt nesting. To identify stack overflows:
- Stack Canary or Magic Number Techniques: Initialize stack memory with known patterns (e.g., 0xDEADBEEF) during system startup. By periodically checking the boundary regions, you can detect if these patterns are overwritten, indicating stack overflow.
- Configure Hardware Stack Overflow Traps: On some microcontrollers, enabling MPU or dedicated stack limit registers can trigger fault exceptions when the stack pointer crosses predefined limits.
- Use Stack Watermarking: Track the minimum unused stack space throughout execution to measure worst-case stack usage and ensure safe buffer margins.
- Monitor Stack Pointer (SP) in Debug Sessions: Using hardware debuggers, periodically inspect the stack pointer to verify it stays within valid bounds.
Addressing Memory Leaks and Heap Corruption
While dynamic memory allocation is often discouraged in embedded firmware due to fragmentation risks, some systems still use it, exposing them to memory leaks or heap corruption that degrade system stability over time. To diagnose these issues:
- Use lightweight memory allocators with built-in tracking of allocations and deallocations.
- Implement custom wrappers around
malloc()andfree()that log memory operations over UART or store metadata in reserved memory areas. - Utilize heap usage monitoring tools in your IDE or specialized embedded memory analysis utilities tailored for microcontrollers.
- Integrate free-running memory integrity checks that verify heap metadata consistency during idle CPU cycles or system maintenance windows.
Tools and Alternatives to Valgrind for Embedded Memory Debugging
Valgrind, a popular memory debugging tool on desktop systems, is not directly available on bare-metal or resource-constrained embedded devices. However, several alternatives and strategies exist:
- Static Code Analysis Tools: Before runtime, use tools like Cppcheck, Coverity Scan, or SonarQube to spot potential memory misuses, buffer overruns, and dangling pointers.
- Embedded Memory Analyzers: Examples include Segger SystemView, Tracealyzer, or ARM Keil RTX Memory Analyzer, which provide runtime insight into memory allocation patterns via instrumentation.
- Custom Instrumentation: Augment your firmware with lightweight instrumentation code that tracks memory usage statistics and alerts on anomalies without significant performance impact.
- Hardware-Assisted Memory Access Monitoring: Certain microcontrollers support watchpoints or breakpoints triggered on illegal memory accesses, enabling catch of out-of-bounds pointers or heap corruption at runtime.
By systematically employing these stack and heap debugging techniques, embedded developers can detect, diagnose, and mitigate memory-related faults that cause elusive crashes and erratic behavior. Emphasizing proactive memory management and leveraging appropriate tools ensures your Raspberry Pi and microcontroller projects maintain high reliability and resource efficiency critical for embedded applications.
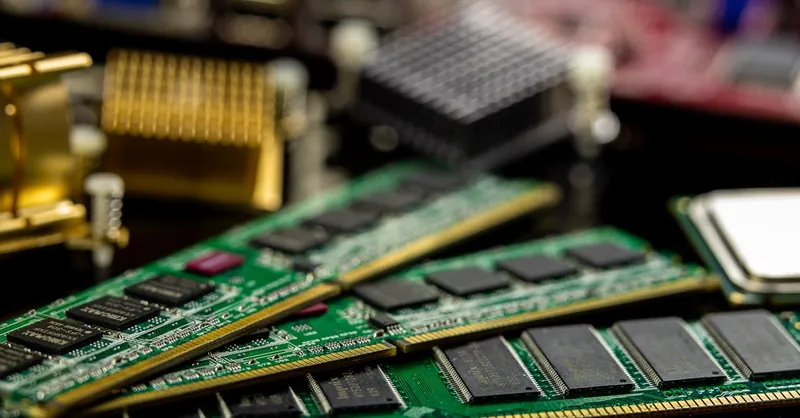
Image courtesy of Sergei Starostin
Static Code Analysis and Automated Testing Tools – Improving Code Quality in Embedded C/C++
Achieving robust, bug-free embedded C/C++ applications requires more than reactive debugging — it demands proactive quality assurance through static code analysis, linting, and automated unit testing frameworks. These tools help detect errors early in the development cycle, enforce coding standards, and prevent common pitfalls that lead to runtime failures or hardware misbehavior in resource-constrained embedded environments like Raspberry Pi and microcontroller projects.
Leveraging Static Code Analysis and Linting Tools
Static code analyzers scan your source code without executing it, instantly flagging issues such as memory leaks, buffer overflows, uninitialized variables, and syntax inconsistencies that are notoriously difficult to detect during manual testing. Popular static analysis tools tailored for embedded C/C++ include:
- Cppcheck – an open-source tool focused on detecting bugs, style issues, and undefined behavior without requiring compilation.
- Clang Static Analyzer – integrated with LLVM/Clang toolchains, offering deep syntax and semantic analysis with detailed diagnostics.
- PC-lint/FlexeLint – commercial-grade linting software with extensive rule sets adaptable for embedded projects.
- MISRA Compliance Checkers – essential for safety-critical embedded software enforcing MISRA C/C++ coding standards.
By integrating these tools into your build process or IDE workflow, you can enforce consistent coding guidelines, improve readability, and uncover tricky bugs before even flashing the firmware. Automated linting also boosts team collaboration by catching stylistic and semantic discrepancies early.
Automated Unit Testing Frameworks for Embedded C/C++
While static analysis guards code health, automated unit testing validates logic correctness in isolation, crucial for catching regressions and verifying hardware interaction abstractions. Embedding unit tests into continuous integration pipelines accelerates feedback and ensures ongoing reliability. Key frameworks and considerations:
- Unity: Lightweight, popular C testing framework designed specifically for embedded environments with minimal RAM and CPU overhead.
- CppUTest: Provides a comprehensive C/C++ testing harness with mocking capabilities, well-suited for embedded firmware.
- Google Test (gTest): Though heavier, adaptable for Raspberry Pi and similar devices with richer resources.
- Test-Driven Development (TDD) practices: Writing tests before the code improves design clarity and facilitates debugging by narrowing failure scope.
To maximize effectiveness, write unit tests targeting critical modules such as peripheral drivers, communication protocols, and memory management functions. Employ hardware abstraction layers (HAL) to isolate hardware-dependent code, enabling tests to run quickly on host machines or simulators without physical devices.
Benefits of Combining Static Analysis and Automated Testing
- Early detection and elimination of defects that would otherwise manifest as runtime faults or hard-to-trace hardware interactions.
- Improved software maintainability and compliance with embedded industry standards like MISRA C/C++.
- Reduced debugging time by catching errors at the source and validating fixes through repeatable test suites.
- Enhanced confidence when refactoring or extending embedded firmware across diverse hardware platforms.
Incorporating static code analysis, linting tools, and automated unit testing frameworks into your embedded C/C++ development workflow transforms debugging from a reactive chore into a structured, preventative process—crucial for delivering high-quality, reliable firmware in all your Raspberry Pi and microcontroller projects.

Image courtesy of Thirdman
RTOS-Specific Debugging Approaches: Tackling Multi-Threaded Embedded Applications
Debugging embedded C/C++ applications running on Real-Time Operating Systems (RTOS) introduces distinct challenges compared to bare-metal systems due to the complexities of multi-threading, task scheduling, and inter-task synchronization. In RTOS environments—commonly employed in Raspberry Pi projects and microcontroller firmware—bugs often arise from concurrency issues such as race conditions, deadlocks, priority inversion, and incorrect resource sharing. Mastering RTOS-specific debugging techniques is essential to ensure reliable, deterministic behavior in your embedded applications.
Key Challenges in RTOS Debugging
- Task and Thread Management: Understanding how tasks are created, scheduled, and terminated is crucial. Bugs may lurk in improper task initialization, incorrect stack sizes, or subtle interactions during context switches.
- Synchronization Issues: Problems often stem from improper use of synchronization primitives like mutexes, semaphores, and event flags. Deadlocks or priority inversions can freeze the system or degrade real-time responsiveness.
- Timing and Scheduling: Since RTOS tasks have priorities and time constraints, timing glitches or jitter may lead to missed deadlines and unexpected behavior, complicating debugging efforts.
- Resource Contention: Multiple tasks accessing shared peripherals or memory without proper protection lead to data corruption or inconsistent system states.
Effective RTOS Debugging Techniques
- Use RTOS-Aware Debuggers: Modern IDEs and debuggers support RTOS awareness, displaying task lists, states (running, ready, blocked), stack usage per task, and scheduler behavior. This visibility allows pinpointing tasks causing faults or starvation.
- Enable Trace and Logging Features: Many RTOSes provide trace utilities (e.g., FreeRTOS Trace, Segger SystemView) that record kernel events like task switches, interrupts, and synchronization calls. Analyzing these traces reveals timing anomalies and resource conflicts.
- Check Stack Usage Per Task: Stack overflows in RTOS threads are common bugs. Monitor individual task stacks to avoid corruption, configuring watermarks and overrun detection where supported.
- Validate Synchronization Primitives: Inspect mutex and semaphore states, watch for recursive locks or unbalanced acquire/release calls. Deadlock detection tools or static analysis may help identify potential pitfalls.
- Prioritize Real-Time Constraints: Use time profiling and CPU load analysis to verify that high-priority tasks meet deadlines and that lower-priority tasks are not starving.
- Leverage Conditional Breakpoints and Watchpoints: Set breakpoints triggered by specific task conditions or resource access, enabling focused debugging without halting unrelated system activity.
Best Practices for Debugging Synchronization and Task Management Issues
- Simplify concurrency by minimizing shared data and employing message queues or event-driven designs.
- Use thread-safe coding patterns and carefully review critical sections to avoid race conditions.
- Test under realistic workloads and stress conditions to surface timing-dependent bugs that may not appear during simple executions.
- Integrate unit tests targeting task interactions and synchronization logic to catch errors early.
- Maintain thorough documentation of task priorities, synchronization schemes, and system timing requirements to assist debugging and future maintenance.
By incorporating these RTOS-specific debugging strategies, embedded developers gain strong control over the complexity of multi-threaded C/C++ applications. Enhanced visibility into task states, synchronization behavior, and timing relationships fosters quicker identification and elimination of concurrency-related bugs—key to building stable, performant embedded systems on RTOS platforms. This deep understanding is indispensable for Raspberry Pi enthusiasts and microcontroller programmers tackling real-world, multitasking embedded projects.

Image courtesy of Markus Spiske
Best Practices and Tips for Efficient Debugging Workflow in Embedded C/C++
Achieving an efficient debugging workflow is essential for mastering embedded C/C++ development on Raspberry Pi and microcontroller platforms. By integrating incremental testing, assertions, and embedding debugging seamlessly into your development cycles, you can substantially reduce debugging time and improve firmware reliability.
Incremental Testing: Build and Debug in Small, Manageable Steps
Instead of writing large chunks of code and then testing, adopt an incremental testing strategy that involves writing small, self-contained units of code and validating each component thoroughly before proceeding. This approach offers multiple benefits:
- Isolates Bugs Early: Catching issues immediately after code addition narrows the scope of errors, making root cause analysis quicker.
- Simplifies Debugging: Testing smaller units reduces the complexity of the debugging environment and system states.
- Facilitates Continuous Integration: Pairing incremental testing with automated builds and tests ensures your embedded system firmware remains stable over time.
For embedded projects, this might mean testing peripheral initialization, communication protocols, or sensor readings independently with defined inputs and expected outputs before integrating them into the larger system.
Leveraging Assertions for Defensive Programming
Integrating assertions into your embedded C/C++ code introduces checkpoints that verify assumptions at runtime. Assertions enable early detection of invalid states, unexpected variable values, or incorrect function inputs—critical factors in preventing cascading errors in embedded systems with limited observability. Best practices include:
- Use lightweight assertion macros (
assert()) or custom implementations optimized for embedded environments. - Enable assertions during debug builds while disabling them in production releases to minimize overhead.
- Complement assertions with detailed error reporting mechanisms, such as serial logs or LED indicators, for rapid fault identification.
- Apply assertions especially in boundary conditions, pointer validations, and state machine transitions.
Assertion-driven development establishes a layer of defensive programming that reduces guesswork and directs debugging efforts precisely where assumptions fail.
Embedding Debugging into Your Development Cycle
To transform debugging from a reactive chore into a proactive design principle, consider integrating debugging activities throughout your development lifecycle:
- Plan for Debugging: Design firmware with test points, debug hooks, and diagnostic commands created early in architecture planning.
- Automate Testing: Incorporate unit tests, regression tests, and integration tests that run automatically on code changes to catch regressions promptly.
- Continuously Monitor Logs and Metrics: Use UART logging, performance counters, or external trace tools during development iterations to detect anomalies before they become critical bugs.
- Document Known Issues and Fixes: Maintain a structured bug-tracking system and knowledge base to accelerate future debugging sessions.
By embedding debugging strategies within your standard workflow, you not only speed up bug detection and resolution but also build more robust, maintainable embedded systems tailored for the unique constraints of C/C++ development on Raspberry Pi and microcontrollers.
Adopting these best practices and tips for an efficient debugging workflow empowers you to tackle embedded C/C++ bugs systematically, reducing costly iterations and increasing your project’s overall success.

Image courtesy of Markus Spiske